
Think about running an online clothing store and noticing a sudden drop in page views over the weekend. You have to think about what caused it. It could be an instant change in your Google Ads keywords affecting visibility, or your customers prefer shopping on weekdays. There is a way to know for sure through data analysis.
If you check your ecommerce performance analytics, the next step is to interpret the data and make informed decisions. For example, you might discover that adding keywords like “weekend party outfit” could improve your store’s visibility and bring back traffic. These insights help you shape your strategy and make smarter business choices.
In this article, we will explore the details of ecommerce data analytics. Also, you will see key areas and how to leverage valuable data. Also, keep reading if you want to stand in the competitive ecommerce world.
More Than Just Data: What is Ecommerce Analytics?
This involves collecting and analyzing data from your online store to understand customer behavior, sales trends, and marketing effectiveness. This data-driven perspective helps businesses make better decisions to improve overall performance and customer satisfaction.
According to Statista, ecommerce reached 20.1% of total global retail sales this year, which shows the growing importance of online shopping in the market.
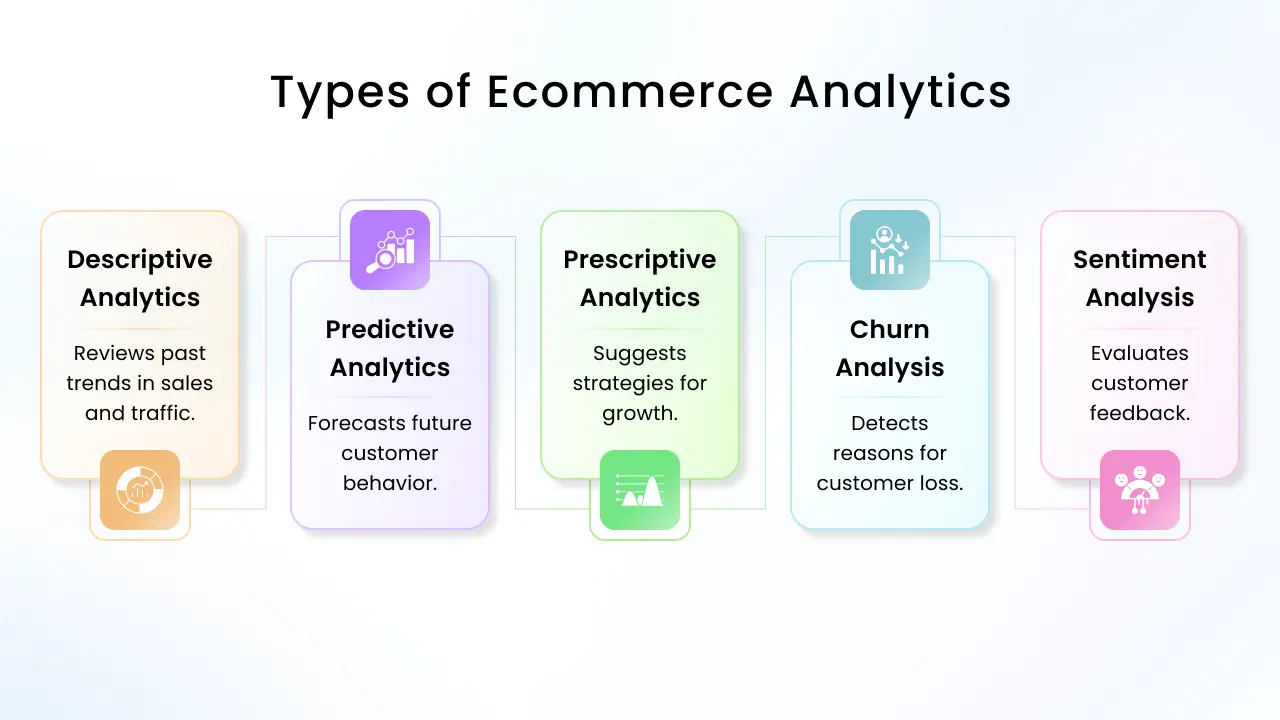
Ecommerce analytics comes in multiple types, offering unique insights to optimize your online business.
How to Implement Ecommerce Analytics in Your Business
Here’s how you can effectively set up this strategy in your business:
Set Clear Goals
Define what you want to track, such as sales growth, customer retention, or conversion rates.
It is helpful to customize specific goals that can focus your analytics effort. For example, if your goal is to grow conversion rates, track the number of visitors who complete a purchase or abandon their carts.
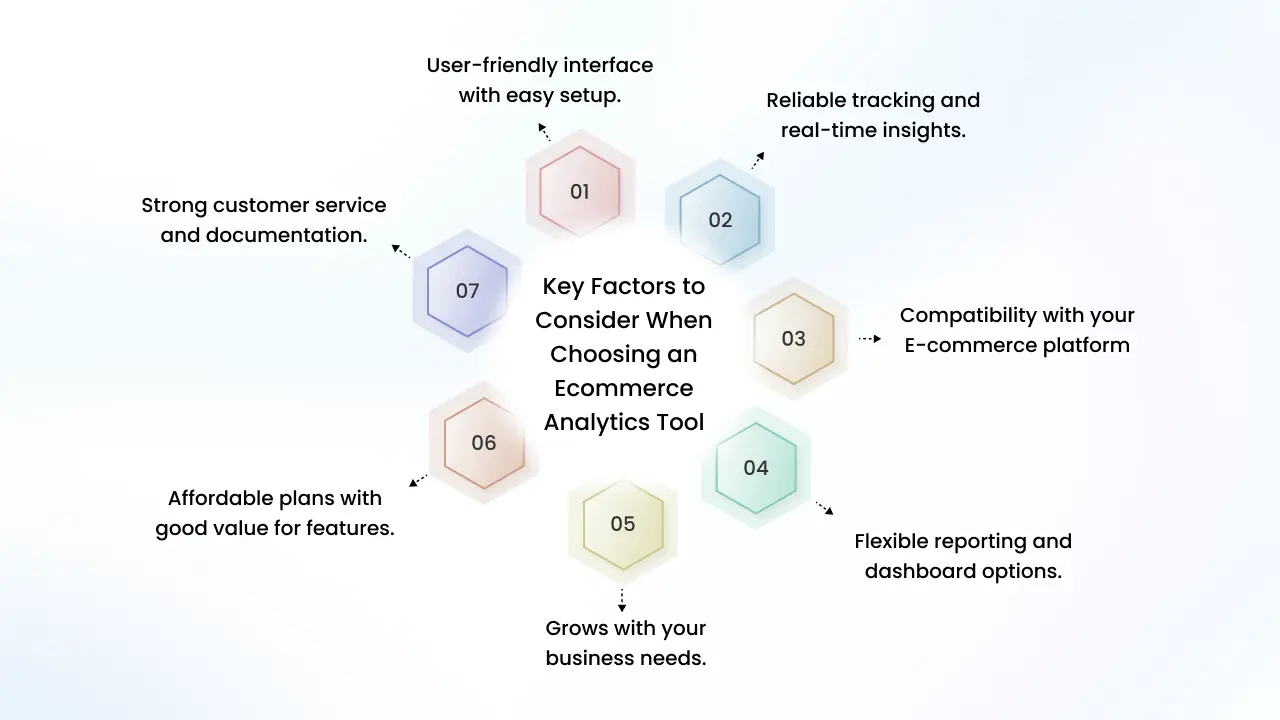
Choose the Right Tools
You need to find the right tools to collect accurate data, and many tools exist to analyze it. We can see examples like Google Analytics, Hotjar, shopify, etc. This is so helpful for understanding how users interact with your site.
Analyze Customer Behavior
Understanding how customers navigate your website is key to optimizing their shopping experience. Track where users drop off in the sales funnel, whether it’s the product page, the cart, or the checkout process. Identifying these patterns allows you to improve by simplifying checkout steps or adding better product descriptions.
Optimize Marketing Campaigns
Impressive data-driven marketing is important for growth. You can use analytics to check your ad campaign results, email marketing staging, and social media engagement. If running ads generate more conversions than others, allocate more budget. If email open rates are low, experiment with other subject lines and customized content.
Enhance the Customer Experience
Do you know that a better shopping experience keeps customers coming back? Use an analytic tool to detect issues like slow load times, confusing navigation, or high bounce rates. If a product page gets a lot of traffic but low sales, it may need better images or more exact pricing information. These main points should be focused on to improve overall user satisfaction and conversion rates.
Test & Improve Continuously
Ecommerce is constantly changing, so your strategy should, too. Keep checking your data, run A/B tests, and tweak things as needed. For example, try two different product page designs to see which increases sales. These small changes can add up to significant results over time.
How to Utilize Data with E-commerce Analytics
One of the core ideas in web analytics is the “sales funnel”, the path customers take from discovering your store to completing a purchase.
Analyzing each stage of the funnel, you can identify where potential customers drop off and make changes to improve conversions.
Example: Online Coffee Store
- A coffee lover sees a social media post about a new organic espresso blend.
- They click the link and land on the product page.
- They read reviews and add the product to their cart.
- They start the checkout process but hesitate when they see the shipping costs.
- They leave the site without purchasing anything.
In this case, analyzing drop-off rates might reveal that high shipping costs discourage purchases. A solution? Offer free shipping over a certain amount or display shipping costs earlier.
Key Areas to Utilize Ecommerce Analytics
Everyone wants to grow their businesses, but to succeed, you need to focus on core areas where analytics can make a meaningful impact. Here are key strategies that expand data analytics in ecommerce to improve business performance:
Discovery – How Customers Find Your Store
Before buying anything, you first have to find the store, right? That’s where the discovery phase comes in. As a shopper, you might land on a website through a Google search, a social media ad, or a post that caught your attention.
From a business point of view, ecommerce analytics helps track precisely how people like you are finding the store, whether it’s from search engines, paid ads, or social media. This insight helps businesses tailor their marketing strategies to meet you where you are.
Key Metrics to Track:
- Impressions — This metric helps you understand how often your content is viewed without anyone engaging.
- Reach – The total number of unique users who have seen your content. Unlike impressions, reach counts only individual viewers.
- Traffic Sources — This is about detecting and tracking where your visitors enter from, whether from search engines, ads, social media, direct visits, or other websites.
- Search Engine Rankings – This shows your website’s performance in search results for relevant keywords.
Engagement – How Customers Interact with Your Content
This is a primary step in converting visitors into customers. It is not just about getting views, you want users to interact by liking, sharing, and clicking on your call to action. Customers find that strong engagement indicates that your content connects with your audience and supports them in taking the next step.
Key Metrics to Track:
- Engagement Rate — This counts likes, shares, comments, clicks, downloads, time spent on a page, and other user interactions.
- Click-through rate (CTR) — This is the percentage of people who click links when viewing ads.
- Time on Page –The average amount of time users spend on a webpage.
CTR = (Clicks/Impressions) × 100
Customer Acquisition – How You Convert Visitors into Buyers
It shows how much you spend to get new customers. You calculate your marketing costs by the number of new customers gained during that time.
Key Metrics to Track:
- Cost per Acquisition – The total cost of acquiring a new customer.
- Cost per Lead – This is the amount customers spend to get someone interested in your product or service. Whether it’s through ads, social media campaigns, or other marketing efforts, it tells you how much you’re paying to generate a potential customer
- Conversion Rate – This is the percentage of people who want to visit your sales channels and make a purchase.
- Lead-to-Customer Ratio – The percentage of leads that convert into actual paying customers.
CPA = Total Marketing Spend/Number of Conversions
CPL = Total Marketing Spend/Total Leads Generated
Conversion Rate (%) = (Conversions/Total Visitors) × 100
Customer Behavior – Understanding Shopping Patterns
Once customers start browsing your website, understanding their behavior is key to improving their shopping experience. This includes analyzing where they drop off in the sales funnel and what factors contribute to their purchasing decisions.
Key Metrics to Track:
- Cart Abandonment Rate – The percentage of users who add items to their cart but do not complete the checkout process. A high abandonment rate may signal issues with pricing, checkout experience, or trust factors.
- Bounce Rate – The percentage of visitors who leave your website after viewing only one page. A high bounce rate might indicate that the landing page content is irrelevant or not engaging enough.
- Exit Pages – Shows which pages users most frequently leave your website from. This helps identify where users drop off on the journey and where improvements are needed.
- Session Duration – Measures the average time users spend on your site. Longer sessions indicate more substantial interest or engagement with your content or products.
- Product Views Per Session – Tracks how many product pages a user views during a single session. This metric helps measure user engagement and interest in your products, not just behavior before a purchase.
Revenue Growth – Maximizing Long-Term Business Success
The goal of ecommerce analytics is to drive revenue growth. This involves monitoring customer spending habits, repeat purchases, and overall profitability.
Key Metrics to Track:
- Customer Lifetime Value – Monitor how much money a customer will spend with a business over time.
- Average Order Value – The average amount spent per transaction.
- Repeat Purchase Rate – The percentage of customers who make multiple purchases.
- Profit Margins – The percentage of revenue that remains as profit after deducting expenses.
AOV = Total Revenue/Total Number of Orders
Ecommerce Analytics Tools to Boost Your Business
Here are some of the most effective tools for analyzing data:
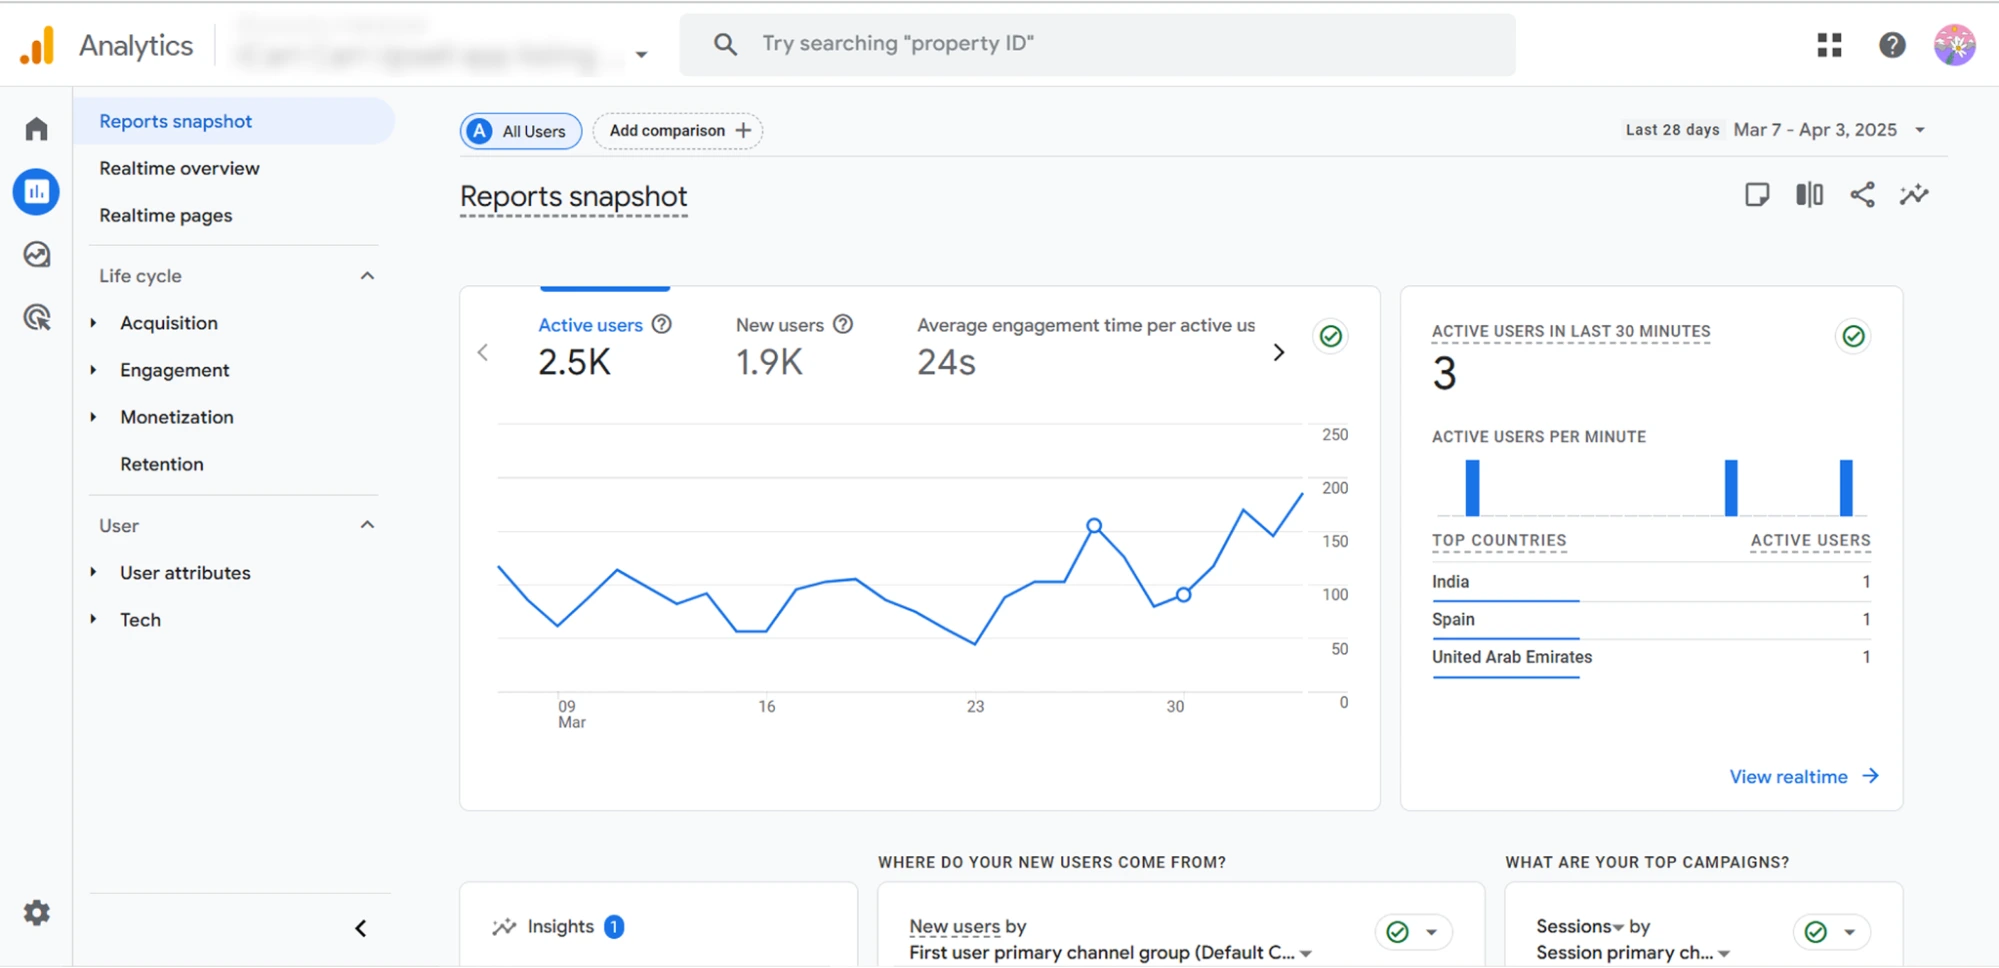
Google Analytics – The Ultimate Website Tracking Tool
This is one of the most potent tools for ecommerce businesses. This tool provides insights into website traffic, user demographics, and behavior. With this tool, you can track how customers search your store, which pages they visit the most, and where they drop off in the buying process. With conversion tracking and goal-setting features, businesses can calculate their success and optimize strategies.
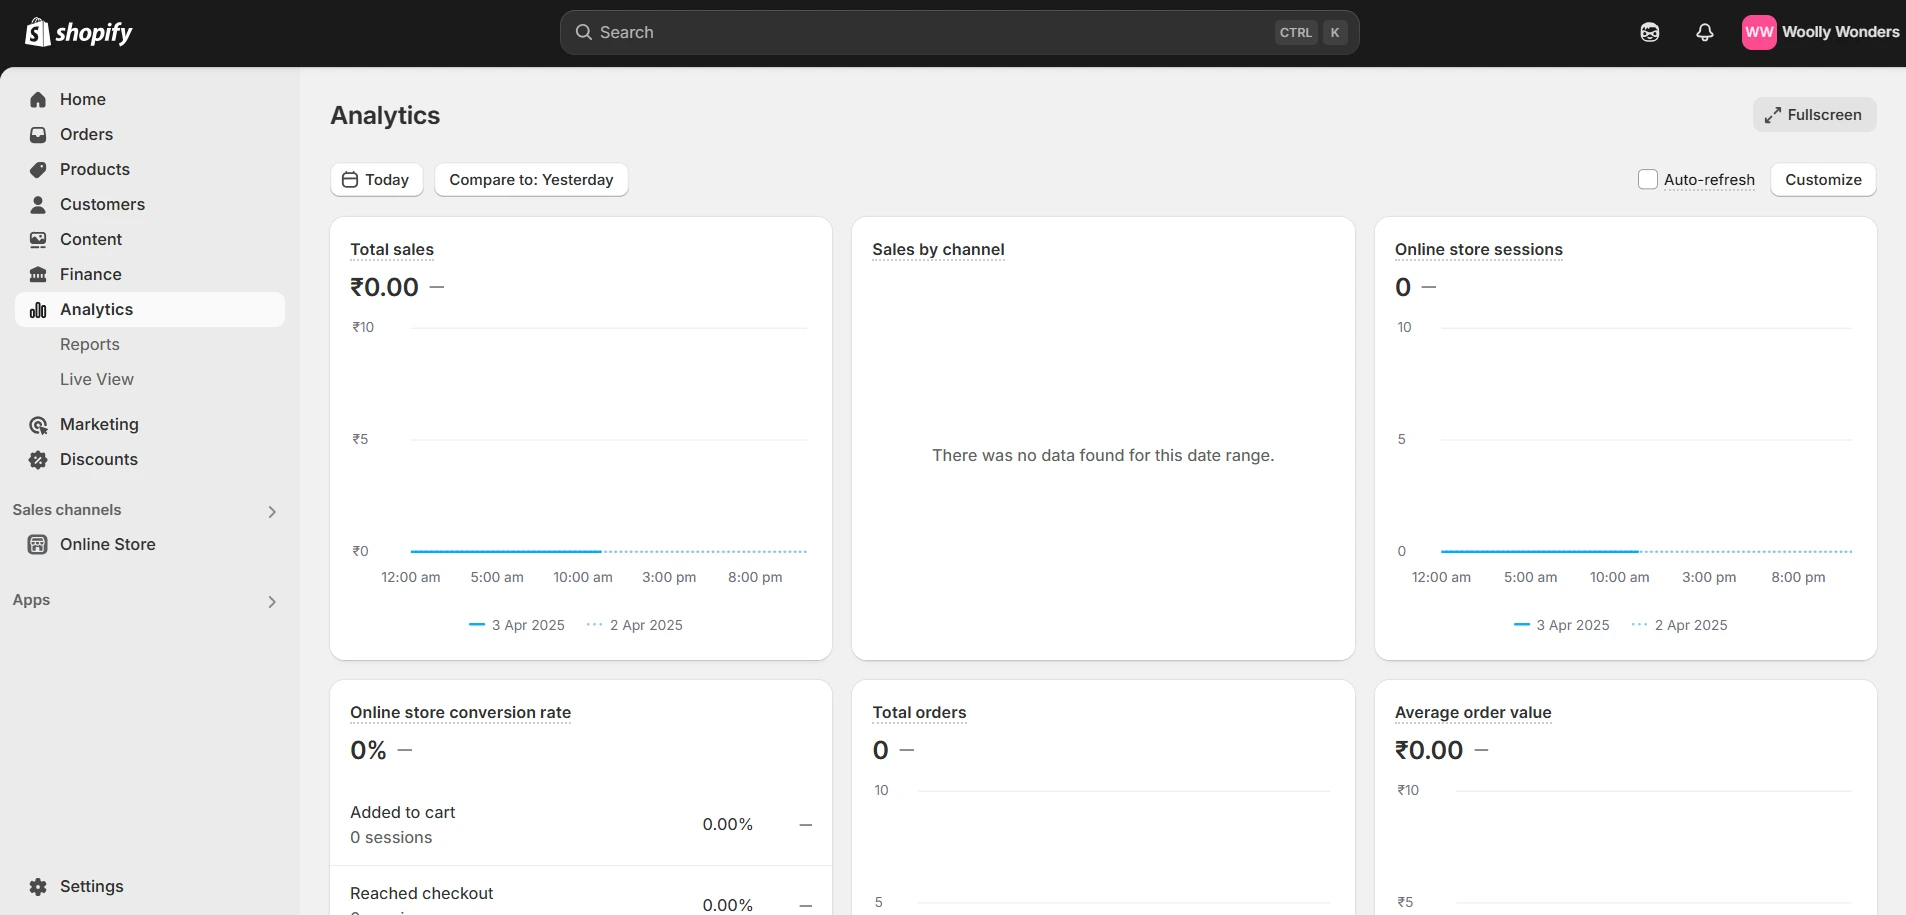
Shopify Analytics – Built-in Insights for Shopify Stores
For those running a Shopify store, this Analytics provides built-in reporting to track store performance. It offers insights into total sales, visitor behavior, customer retention rates, and product performance. Businesses can analyze which products sell best, identify peak sales times, and measure marketing campaign effectiveness, all within the Shopify dashboard.
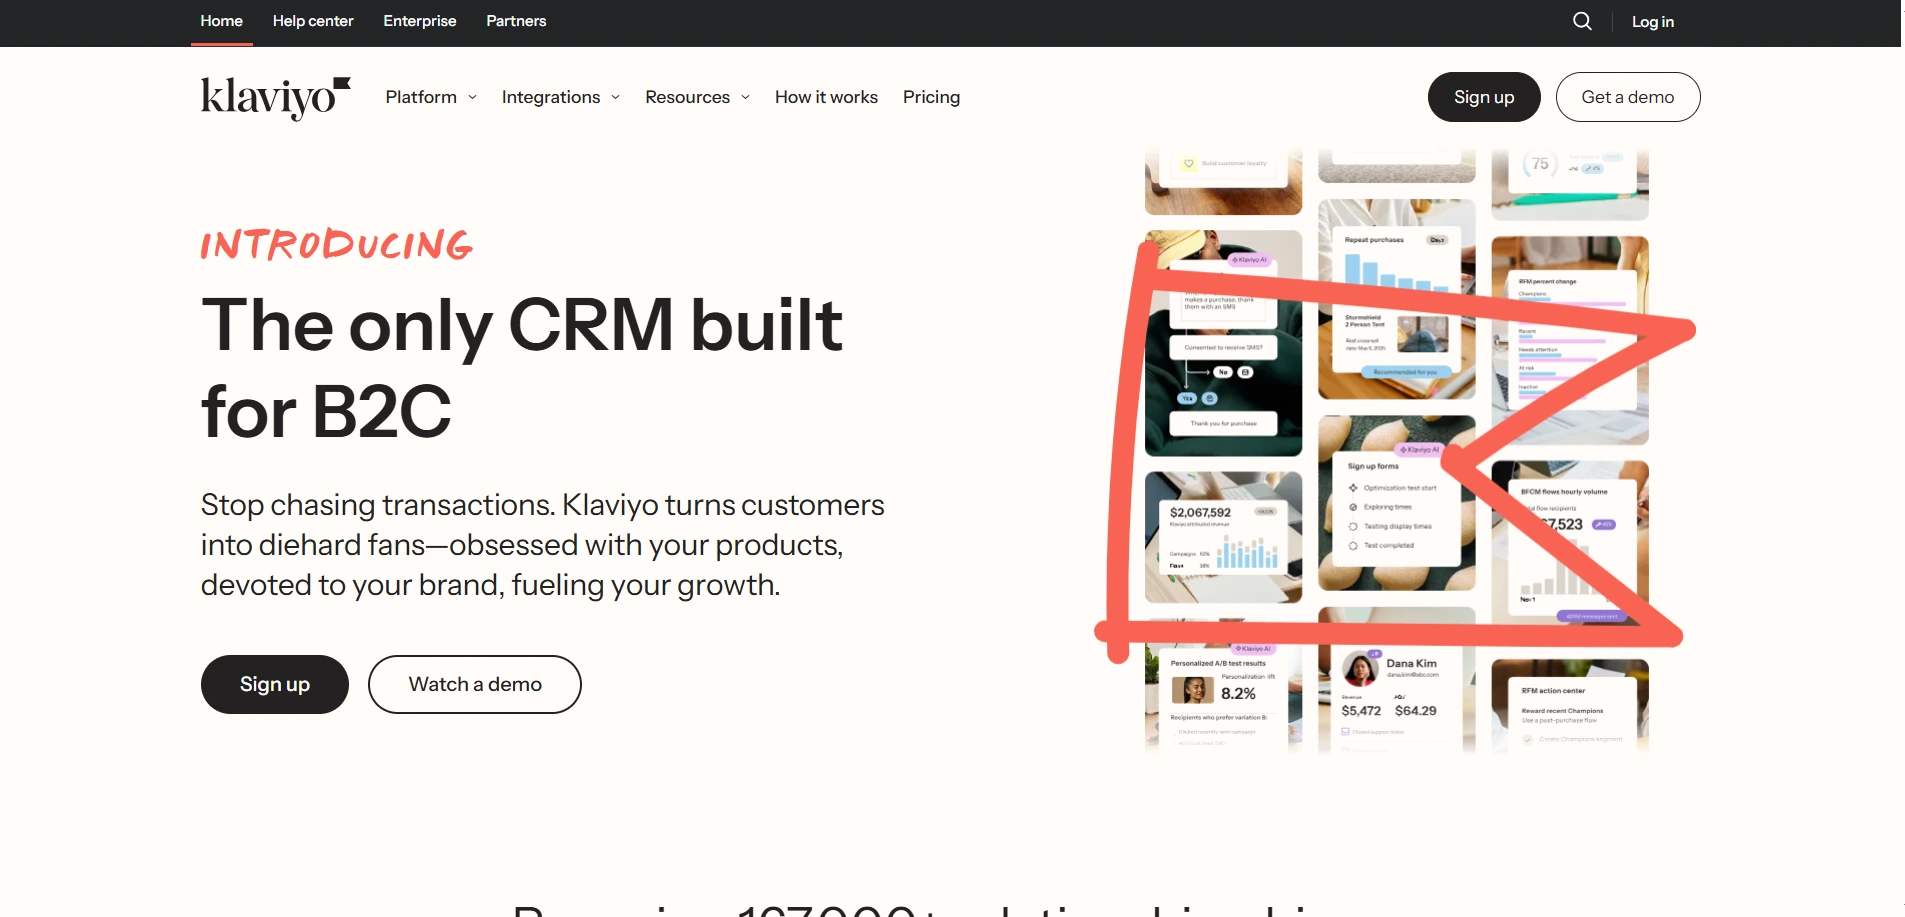
Klaviyo – Email Marketing Analytics and Segmentation
Klaviyo helps businesses track email performance, including open rates, clicks, and campaign sales. In other words, with the advanced part, you can send personalized emails based on customer behavior and purchase history, increasing conversions and customer loyalty.
Hotjar – Understand User Behavior with Heatmaps
Hotjar helps businesses understand how users interact with their website using heatmaps and session recordings. It detects where visitors click, scroll, and spend the most time, helping improve website design. We suggest watching session recordings to find issues that may cause visitors to leave without buying.
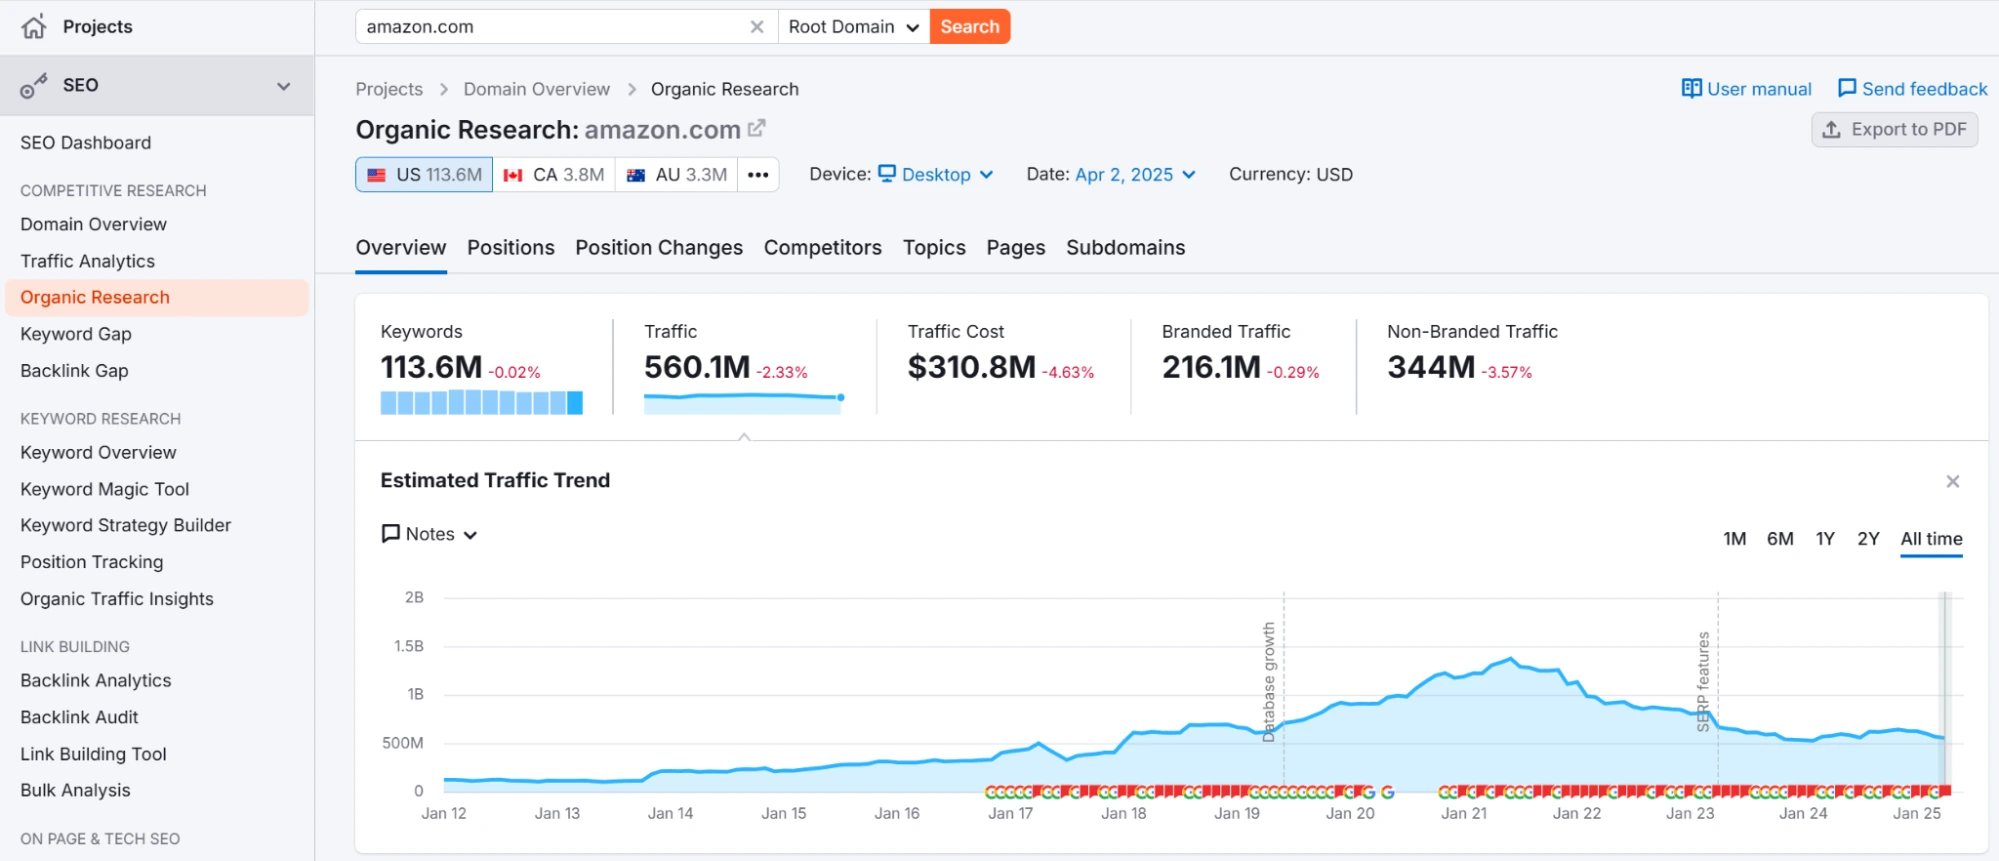
Semrush – Improve SEO and Search Rankings
Semrush helps improve ecommerce visibility on search engines. It can track keyword rankings, competitors, and backlinks. This tool shows analysed SEO performance, businesses can optimize product pages, blogs, and ads to attract more visitors and increase organic traffic.
Data is Your Greatest Ally in Ecommerce Success: Wrap-Up
In today’s competitive online market, choosing the right analytics tools and strategies can significantly shape your path to success. While countless metrics are available, focusing on the ones that align with your business goals is crucial.
By understanding your data and applying insights effectively, your e-commerce store can drive more intelligent decisions, improve customer experience, and achieve long-term growth. In the end, data is not just numbers, it’s the key to staying ahead in the market.
FAQs
1. How can ecommerce analytics increase sales?
It is finding that key metrics such as conversion rates, customer retention, and traffic sources help businesses increase sales.
2. How do I track customer behavior on my ecommerce store?
Use tools like Google Analytics, Shopify Analytics, or Hotjar.
3. What is the role of AI in ecommerce analytics?
It analyzes large datasets quickly, predicts trends, and offers recommendations, setting up improved judgement and customer experiences.
4. How often should I analyze my ecommerce data?
You should review data weekly for procedure insights and monthly for strategic decisions.




About the author
Bhavesha Ghatode
Explore Content with Bhavesha, a passionate and dedicated technical content writer with a keen understanding of e-commerce trends. She is committed to sharing valuable insights, practical assets, and the latest trends that can help businesses thrive in a competitive environment.